


It is now exactly a year since the markets started correcting in late September 2024 and despite the recovery from the lows, indices are still in the red on a one-year returns basis.
In an atmosphere where global cues are challenging with penal trade tariffs, exporters being hit, AI-related job disruptions and geopolitical tensions, you would expect investors to be exercising caution in going down the market capitalisation curve. Also, FPIs are continuing with their selling spree.
However, domestic mid- and small cap mutual funds are continuing to receive strong inflows over the past 12 months.
Small-cap schemes have received ₹93,499 crore in gross inflows and ₹51,874 crore in net inflows (after redemptions) over the last 12 months till August 2025, according to data from AMFI and Franklin Templeton monthly Dashboard.
Mid-cap mutual funds got ₹93,287 crore gross and ₹50,174 crore net inflows.
large-caps lag
In contrast, large-cap schemes got only ₹68,105 crore in the last 12 months as gross inflows.
The net inflows were much lower, at ₹28,766 crore, suggesting that investors sold large-cap funds more aggressively than mid- or small-caps.
Compare this against the market-cap of Nifty 100 TRI (total return index) at ₹269 lakh crore, which is more than 3x the Nifty Midcap 150 TRI at ₹85.79 lakh crore or almost 6x that of the Nifty Small Cap 250 TRI at ₹45.06 lakh crore.
In this backdrop, it is clear the small- and mid-cap funds are receiving a disproportionate share of the inflows.
Even as investors seem to ignore valuations while pumping in money, active funds tracking the respective market capitalisation benchmarks have contained downsides well.
go by to Valuations
Data from the NSE show that the Nifty Small Cap 250 TRI trades at a PE (price earnings) multiple of 31.5 as of August 2025, and a PB (price to book) of 3.6.
The PE multiple for the Nifty Midcap 150 TRI is 32.1, while its PB is 4.5. This despite these indices correcting 7.4 per cent and 3.8 per cent in the last one year and many stocks in these benchmarks falling 30-40 per cent.
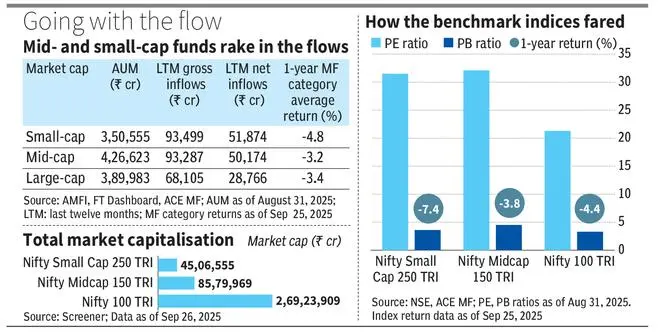
In contrast, the large-cap Nifty 100 TRI trades at a PE of 21.3 and a PB of 3.3. The benchmark trades at a significant discount to its mid and small cap counterparts.
The fact that investors are willing to plough in money at elevated valuations indicates increased risk appetite and a belief that returns will come in the long term.
A spate of IPOs (initial public offerings) in the last few years from the mid- and small-cap companies that came asking for high multiples and subsequently have been included in the indices may have added to the overall benchmark valuation increases.
In the last one year, the large-, mid- and small-cap indices fell 4.4 per cent, 3.8 per cent and 7.4 per cent, respectively.
Funds deliver
However, active small-cap funds fell only 4.8 per cent on an average in the last one year. Mid-cap funds declined only 3.2 per cent as a category, while active large-cap funds saw their NAVs fall 3.4 per cent in the past 12 months.
Thus these funds, especially from the mid- and small-cap categories, have contained downsides well in a turbulent year.
Since many small-cap funds have closed lumpsum investments, most investors must be taking exposure via the SIP route.
In the long term, it would be better to exercise caution with mid- and small-cap funds as building a balanced long-term portfolio must see a greater tilt towards large and flexi-cap mutual funds.
Published on September 27, 2025


