

You can be a good stock picker. You might know a company like the back of your hand – its balance sheet, management and competitive advantages. Still, you could be blindsided by the economy, if you fail to pay attention to the macros.
Think of it like an excellent sailor who ignores the weather forecast. Your boat might be seaworthy, but if you are sailing into a hurricane, your nautical skills won’t save you.
This is an uncomfortable truth that investors often learn the hard way. They often tend to spend countless hours poring over annual reports, analysing margins and modelling cash flows. But companies do not operate in silos. They exist within the confines of the broader economy, which is influenced by a plethora of factors one can barely anticipate. It is how a company navigates through these economic currents that ultimately decides its fate.
Consider this. You may be betting big on a car company with strong fundamentals. But what if the economy isn’t geared for consumption? The lack of demand might soon impact your company’s sales and thus, you may have to settle for modest earnings, disproportionate to the price you may have paid for the stock. The company hasn’t changed; the economic backdrop has.
Hence, knowing the language of the economy becomes paramount for a fundamental investor. A challenge, however, is that the real progress report of the economy – GDP growth, is released two months after the end of a quarter and acts as a mere rear-view mirror.
For a savvy investor, to make calls ahead of inflection points, tracking reliable economic indicators and the macro trends they reveal can be quite useful in making the right investment decisions. This is where high-frequency indicators become invaluable. Serving as the real-time language of the economy, most of these indicators are released monthly, some even fortnightly, offering a pulse check on economic health as it unfolds.
There are countless high-frequency indicators one can monitor. However, some are more relevant and accessible for a wide range of investors. Here, we’ve curated some of them, explaining what they mean, how to interpret them and where you can track them.
Credit growth
Credit needs no introduction. By credit in this context, we mean that which is borrowed by businesses and individuals – also known as private credit. Growth or decline in private credit is an excellent indicator of the direction of economic activity.
It’s quite straightforward. Credit creates purchasing power for businesses and individuals, and, in turn, stimulates demand for goods and services, when businesses and individuals consume or create fixed capital (invest in productive assets). When there is growth in private credit, it indicates an appetite for consumption and a willingness to invest among individuals and businesses respectively. Private final consumption expenditure (PFCE; i.e. when individuals and businesses consume) and gross fixed capital formation (capital expenditure) account for roughly 60 per cent and 30 per cent of nominal GDP respectively.
Given this, gross bank credit and nominal GDP have an extremely high correlation. In fact, the coefficient of correlation is just a few basis points shy of perfect positive correlation, at 0.9972 over the last 20 financial years. With such strong correlation, while credit growth can help decode where the economy is headed, it does not suggest the magnitude of growth or decline in economic activity. Hence, it need not be used as a sole variable to forecast economic growth.
In FY23, gross bank credit grew 15 per cent and nominal GDP grew 14 per cent. In FY24, credit grew 21 per cent, but GDP grew 12 per cent. As credit growth fell to 11 per cent in FY25, GDP growth, too, moderated and recorded a growth of 10 per cent. If one had been tracking the trend in credit growth (fortnightly), the moderation in GDP growth wouldn’t have come across as a surprise (Chart 1). Hence, by tracking credit growth, investors can make a decent assessment of the vigour of economic activity and make inferences on how this could impact market sentiment.
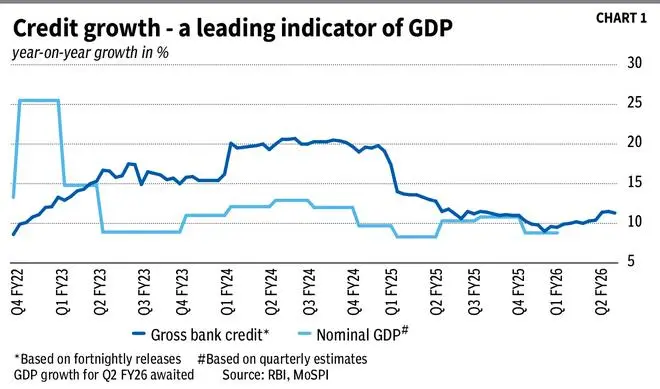
Data on gross bank credit is released by the RBI every fortnight; however, with a lag of two weeks. For example, bank credit as of fortnight ended October 31 was released on November 14. Investors can refer to source 1 for the link to the dataset.
While this tracks bank credit at the aggregate level, RBI also has data on the sectoral deployment of credit, which classifies outstanding bank credit into industrial loans, housing loans, etc. Here the data is monthly, but the data is updated with a relatively-longer lag. As of today, the table stands updated till August 2025. Refer source 2 for the link to the dataset.
Tracking growth in loan categories such as housing, consumer durables, vehicle loans and credit cards will be useful for investors interested in realty, consumer durables, auto and consumption sectors respectively.
In the current financial year, so far, bank credit has grown 11.3 per cent year on year. However, until fortnight ended August 22, it was 10 per cent. With the rationalisation of GST rates, credit growth accelerated in the succeeding fortnights to 11.3 per cent as of October 31. Given the strong correlation, one can also infer that in these fortnights, GDP growth could’ve got a fillip.
Inflation
Inflation is often held in a negative connotation. However, a controlled level of inflation is absolutely essential for an economy to grow.
Imagine a deflationary scenario — tomorrow’s prices would be lower than today’s. In this case, would anyone consume today? Inflation is partly why people consume. Because in a deflationary scenario, consumers will postpone purchases under the assumption that prices will be cheaper in the future, and this by itself will have a detrimental impact on the economy.
This is why central banks of the world are fixated on maintaining inflation in a sweet spot range — neither too high, nor too low, but in a range that will support sustained, robust, long-term economic activity. The RBI’s target is to maintain inflation at 4 per cent with a two-percentage point tolerance band on either side.
The RBI’s target is based on the CPI or the consumer price index, which measures inflation at the point of ultimate consumption. The index is released monthly by MoSPI (Ministry of Statistics and Programme Implementation), generally with a lag of 10 days to two weeks. Refer source 3 to access the dataset.
As can be observed from the dataset, inflation has been kept within the RBI’s range since March 2023, discounting a couple of odd months. This is after a bout of inflation at about 7 per cent in 2022, led by supply-side factors such as unfavourable weather causing food prices to spike (food accounts for about 45 per cent of the CPI basket). Inflation was brought under control — both as a result of keeping liquidity in check and better weather conditions. The CPI grew a mere 0.25 per cent in October, well below the RBI’s target range.
With prices continuing to be benign, since February, RBI has been on a monetary easing cycle — cutting repo rate by 100 bps and injecting ample liquidity. These along with fiscal measures such as personal income-tax breaks and GST rate cuts could spur demand and rekindle inflation on the demand side. This theory explains why in the latest monetary policy statement (October), the RBI expects prices to grow 1.8 per cent and 4 per cent in Q3 and Q4 of FY26, and 4.5 per cent in Q1 FY27.
From a market perspective, armed with an understanding of the trajectory of inflation, investors can make a call on how interest rates are likely to trend. Interest rates determine the cost of capital, which is a key variable in arriving at the intrinsic value of stocks. Further, interest rates also have a direct impact on economic activity and market sentiment. Very high interest rates tend to have an adverse impact and would also influence valuations and corporate profits
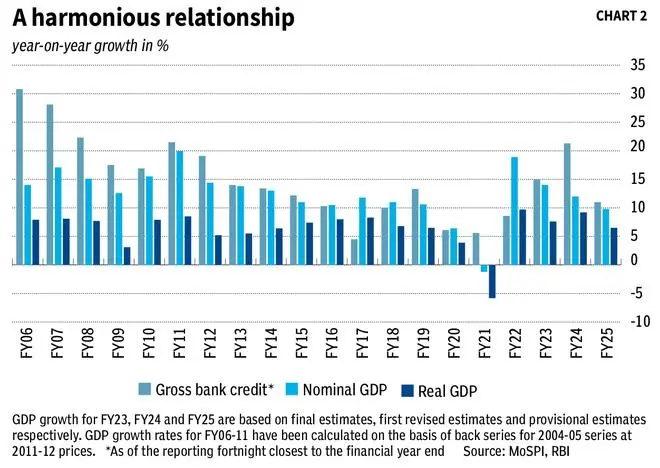
Keeping the above two indicators in mind (credit growth and inflation), it is important for investors to understand how the same level of credit growth but at different levels of inflation can have a different impact on real GDP (nominal GDP adjusted for inflation). For example, credit growth in FY24 was 21 per cent, similar to FY12’s 19 per cent. However, inflation in FY24 grew just 5 per cent, compared with FY12’s 9 per cent. Thus, real GDP grew faster at 9 per cent in FY24, versus 5 per cent in FY12 (see chart 2).
Manufacturing PMI
The manufacturing purchasing managers’ index (PMI) is a popular indicator to gauge the direction of manufacturing activity in the country. Released monthly, the index is a number that varies between 0 and 100. A reading above 50 denotes expansion in manufacturing activity over the previous month and one below 50 denotes a contraction.
The index is officially called HSBC India Manufacturing PMI and is compiled by S&P Global. The methodology is pretty simple. The headline PMI is a weighted average of five indices/ parameters — new orders (30 per cent), output (25 per cent), employment (20 per cent), suppliers’ delivery times (15 per cent) and stocks of purchases (10 per cent). The calculation is based on the results of monthly surveys (usually in the second half of a month), where about 400 manufacturers participate.
If a participant has observed ‘new orders’ increase for her company during the month, she would mark a ‘higher’ response against new orders. Had they remained constant during the month versus the previous month, she would mark an ‘unchanged’ response. If ‘ ‘new orders’ had in fact reduced, it need not be responded to. She then would have to respond in a similar fashion for the rest four parameters.
Thus, responses of all participants are collated. The headline index is then calculated as the sum of the percentage of ‘higher’ responses and half the percentage of ‘unchanged’ responses.
Refer source 4 to access the latest PMI release.
However, the entire data set is not available on the official website. Readers can get the same on websites such as Trading Economics, where data is available from November 2022. This apart, every release has a rough chart of the index dating back to 2008. It can be seen that during difficult phases, such as in 2009 and during the pandemic, the index did fall sharply below 50. However, post the recovery from the pandemic, the index has a solid track record of keeping above the 50-mark. Though unlikely in current circumstances, investors must watch out for any sustained decline in the index.
S&P Global also provides the Services PMI and Composite PMI, which are to be interpreted in the same manner as the Manufacturing PMI – above 50 implies expansion. The Composite PMI is just a weighted average of the Manufacturing Output Index (basis for Manufacturing PMI) and the Services Business Activity Index (basis for Services PMI), where weights reflect the relative size of the manufacturing and service sectors, according to official GDP data. Hence, the Composite PMI can be viewed as indicating an expansion or contraction in the overall economy. Both the Services and Composite PMIs can be accessed on the same website.
Index of core industries
The index of core industries or ICI is another indicator to gauge economic activity. It is released monthly by the Office of the Economic Adviser, usually with a lag of a couple of weeks. Refer source 5 to access the dataset.
The ICI measures both collective and individual performance of production in selected eight core industries — refinery products (28 per cent), electricity (20 per cent), steel (18 per cent), coal (10 per cent), crude oil (9 per cent), natural gas (7 per cent), cement (5 per cent) and fertilisers (3 per cent). Figures in parentheses indicate the weightage of the industry in the blended index.
Output of these industries are key inputs in manufacturing and infrastructure sectors. An increase in the index, for instance, suggests increased offtake of these inputs, indirectly giving away the optimism of user industries (manufacturing, infrastructure, etc). Hence, tracking this index does make sense for an investor in such user industries, more so for one invested directly in the sectors of power, oil and gas, cement and steel.
Like credit growth, ICI also has a near-perfect positive correlation with nominal GDP, with a coefficient of 0.9905 for data between FY12 and FY25. After a spell of good growth – 7.8 per cent in FY23 and 7.6 per cent in FY24, the index moderated to a growth of 4.5 per cent in FY25, which showed in nominal GDP as well. Reiterating, nominal GDP grew 14 per cent in FY23, 12 per cent in FY24 and 10 per cent in FY25.
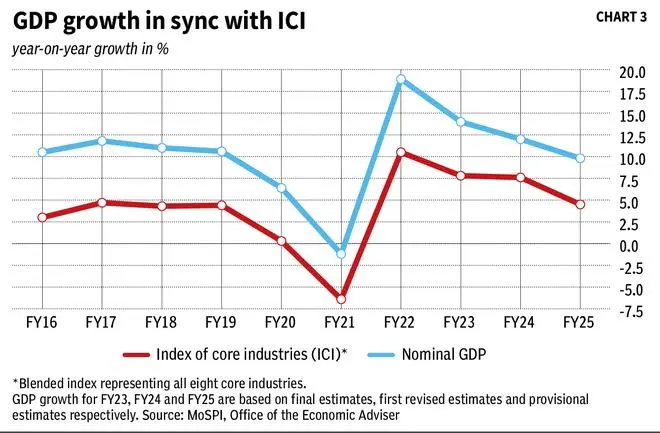
In the current fiscal year, between April and October, the index has grown a mere 2.5 per cent, partly explaining a lower growth in nominal GDP in Q1 FY26 at 9 per cent versus the 10 per cent in FY25. With consumption expected to revive in H2 FY26 and about 50 per cent of budgeted Central government capex yet to be incurred (refer source 6 to access the dataset), investors can look out for a revival in this index.
Consumption indicators
There are three high-frequency indicators which are useful for investors in sectors such as FMCG, consumer durables/ consumer discretionary, digital commerce and so on. They are auto sales volume, GST collections and digital payments. All three are released in monthly intervals and accessible from sources 7 to 9.
Here’s the rationale why these can be good indicators of consumption. Vehicle sales volume is representative of consumers’ propensity to spend on big-ticket items. GST is a consumption-based tax, and the tax incidence falls on the ultimate consumer. Finally, after the advent of UPI, the country’s retail payments have gone through a great deal of digitalisation, bringing substantial payments volume under the fold of organised sector. Hence, it would be safe to say that today, digital payments could account for a good chunk of PFCE. Recent reports suggest that the National Statistics Office is mulling analysing UPI data for GDP estimates.
All in all, analysing trends in these indicators do make sense for investors interested in the consumption sector. However, do bear in mind that factors such as expansion of the taxpayer base, tax rate changes, merchants shifting to digital modes of accepting payments distort the picture, and so, trends in these indicators may not faithfully capture pure incremental consumption.
Other indicators
To be fair, we have barely scraped the surface of the world of macroeconomic indicators in this story. There are numerous other indicators that interested investors can analyse such as corporate tax collections, volume of e-way bills, unemployment rate, housing sales, hotel occupancy, air traffic and so on. We will write more on these in our future editions.
These apart, the RBI website can be the best place to start for investors curious about macroeconomic indicators. It houses data on order-books, capacity utilisation of companies, indices on consumer confidence and a lot more. The ‘State of the Economy’ section of its monthly bulletin, too, is worth checking out.
Do note that the indicators are not perfect. They do suffer from distortions caused by data revisions, base effects and one-off policy shocks, that might raise false alarms. Nevertheless, practice can you help you overlook such distortions, connect the dots and make the indicators an effective tool in your investing arsenal.
Published on November 22, 2025


