The Debasement Trade is the new buzzword in town. As recently as last Thursday, legendary investor Ray Dalio and founder of Bridgwater associates, one of the world’s largest and most-famous hedge funds, termed gold as the “safest money.” A month ago, he had also explained why current times are like the early 1970s and investors must hold more gold than usual. Morgan Stanley’s CIO Mike Wilson also said a month ago that he now prefers a portfolio allocation of 60 (equities)/20 (fixed income) / 20 (gold) portfolio versus the long-established 60/40 portfolio of 60 per cent in equities and 40 per cent in fixed income. He terms gold as the “anti-fragile asset to own, rather than Treasuries.” The list goes on.
And all these shifts in views are playing out after gold has already been the outperformer this decade vs other asset classes, including equities. Their comments also signal that their part of the world is relatively underinvested in gold.
But for the gold bugs and the macro purists, this would be hardly surprising at all. After all, the simplest solution is always the best! The Occam’s Razor or Principle of Parsimony, as it is called, would have worked brilliantly as in other times too, if one had applied this logic in investing during the throes of the Covid attack five years ago. Exponential amount of time, money and efforts were expended in attempting to forecast which stocks would do well over the next few years. While some of these forecasts worked, some failed spectacularly, and many have underperformed gold. A gush of money printing and economic uncertainty then were clear structural factors that would have made gold the simplest solution for investment. Complication of geopolitics, since the start of the Russia-Ukraine war and US-China rivalry/tensions, added more momentum to the favourable tide.
The question that many have now though is, whether the year to date run-up in gold (in USD) of 53 per cent, following a 48 per cent upside in 2024 is rational? While after such a run, there will be high volatility and corrections, as we have seen in the last two weeks, our take is that the run-up is largely rational. In our article titled ‘Goldilocks Moment for Gold’ in bl.portfolio edition dated March 17, 2024, we had laid out threadbare why the outlook for the yellow metal was rosy and it remained an attractive investment for long-term investors despite the fact that it was trading at its all-time high of $2,182 at that point in time. With 83 per cent returns in USD terms in the 20-month period since then, we believe while the best entry point is obviously behind, the case still exists that gold is likely to outperform equities when one takes two-three year perspective from here – whichever the direction of the asset classes. This implies that on a relative basis, its attractiveness vs equities remains and investors who want to remain heavily invested can consider increasing allocation to gold as compared to equities in their portfolio.
In a two-part series (in the current and next bl.portfolio editions), we will explain why the case for gold’s outperformance over equities exists.
History of gold in the contemporary era
There can be few fields of human endeavour in which history counts for so little as in the world of finance. Past experience, to the extent that it is part of memory at all, is dismissed as the primitive refuge of those who do not have the insight to appreciate the incredible wonders of the present. – John Kenneth Galbraith
To understand where gold is headed in the current decade, it is important to understand the history of gold in the contemporary era. That gold is a great store of value is well borne by 5,000 years of history, but the pulls and plugs that influence its performance can be understood by analysing its decadal performance vs other asset classes in the contemporary era.
The 1970s
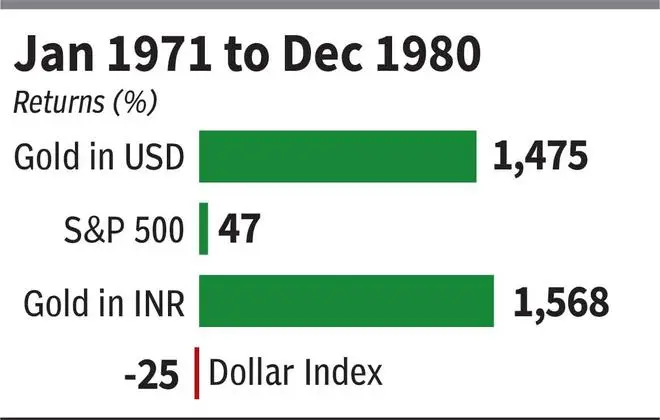
The ‘Me’ decade was famous and infamous for many things — the cultural shift in US to self-focus and individualism over social activism, end of the Vietnam war, the Watergate scandal and more. But the most defining factors from an economic standpoint were the Nixon Shock, Federal Reserve mis-steps, West Asian conflicts, oil embargo and the Iran revolution.
All these combined created a perfect economic storm and a decade of stagflation in the US that resulted in gold returning a staggering 1,475 per cent returns. Compare this to S&P 500 returning just 47 per cent and underperforming fixed income!
Under the Bretton Woods system, established in 1944, the US dollar was adopted as the main global reserve currency and was pegged to gold at a fixed price of $35 per ounce. Other major economies that were part of the system pegged their currency to the US dollar, while allowing to fluctuate in a narrow band. As the US economy underwent some pressures in the late-1960s and early-1970s and budget deficits increased, the pressure on the USD increased. Other countries holding dollars as reserves, hence, had an incentive to convert their dollar holdings into gold as a safer option. More countries moving in this direction would have resulted in a run-on-the-bank type of situation, as dollar peg to gold was based on a fractional gold reserve system and there wasn’t enough gold to back all the dollars. Under pressure, Richard Nixon suspended the gold standard on August 15, 1971 and made the USD a fiat currency in what is infamously known as the ‘Nixon Shock’.
This caused the dollar index (DXY) to plunge over 10 per cent in the next few months after being stable at around 120 for many years till then. Gold prices more than doubled in the next two years. This was followed by Yom Kippur War in West Asia and the oil embargo by some Arab countries on those supporting Israel, which included the US. During the around five-month period of the oil embargo, gold prices shot up by another 70 per cent, effectively going up nearly 400 per cent from the levels before the Nixon shock. The compounding was well on its way and only accelerated as the US economy endured a decade of stagflation — slow growth/recession and high inflation. This was complicated by US Fed’s mis-steps. During the early part of the decade, the Federal Reserve Chairman at that time, Arthur Burns, prematurely reduced interest rates, apparently under political pressure, which resulted in a resurgence in inflation. With the Iran Revolution of 1978-79 and another oil shock and higher inflation, and after a decade of persistently-high inflation, public confidence that inflation would be brought under control was eroded.
Gold going up 15 times in that decade was the outcome of all this mess. Gold’s performance in its great bull-run in that decade can be split into three parts — 1971 to 1974-end when it was up 400 per cent; 1975 to 1977-end when it was down 6 per cent during which it also entered bear market territory; and 1978 to 1980-end when it was up 235 per cent.
The 1980s
If it took the ‘Nixon Shock’ to ignite the fire of the gold bull-run, it required a ‘Volcker Shock’ to douse the fire and restore public confidence in fiat currency.
When Paul Volcker took over as the Federal Reserve Chairman in August 1979, inflation in the US was raging at 9 per cent and was trending up over the next year despite the central bank’s attempts to control money supply. Part of the problem was inflation expectations. By the end of the 1980s, inflation expectations were high and remained unanchored — after a decade of high inflation, it had got into public psyche that high inflation was a permanent phenomenon and they had no confidence that monetary policy would rein it. Under such conditions, employees demand higher wages, people advance buying decisions under the assumption that prices would be higher weeks or months later, and companies try to raise prices. Effectively, this behaviour of individuals and corporates accentuated and exacerbated the inflationary trend. To quell this and restore public confidence in monetary policy, Volcker delivered a series of interest rate increases, taking it up to 18 per cent in the 1980s. After modestly lowering it to 16 per cent and not getting the desired result, he increased the interest rates to 20 per cent in May 1981, taking the real interest rate (Fed Funds Rate – CPI inflation) to an unprecedented 10 per cent. This was a striking blow to the economy. But it was the short-term pain that Volcker felt was required to vanquish inflation and restore public confidence in monetary policy. Short-term pain for long-term good was the trade he took.
Post the Volcker shock, during 1981-82, the US economy endured one of its most-severe recessions in the post-World War II era. Unemployment rate went up to 10.8 per cent in 1982 — the highest since the Great Depression.
But the good thing: Events turned out fine, as Volcker expected, at the other end of the tunnel. Inflation fell from a high of 11-12 per cent in 1981 to below 4 per cent in December 1982. From then till the end of the decade, monthly CPI inflation in the US averaged 3.9 per cent versus 8 per cent in the previous decade.
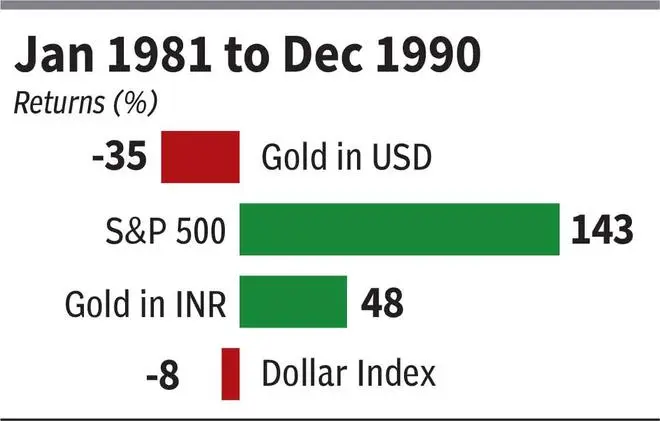
With his measures, Volcker put an end to the great gold bull-run for the next two decades. When real interest rates are taken up to as high as 10 per cent, like it was for a while in 1981, fixed income is much more attractive than gold or equities. In the year of the Volcker Shock alone, gold fell 33 per cent; S&P 500 fell 10 per cent.
A few months later in 1982 is when a great bull market started for US equities that extended for nearly 18 years and culminated in the dotcom bubble of 2000.
One exception to the reversal of the trend in this decade was the dollar index, which actually fell 8 per cent. This was because of Plaza Accord — the US negotiated an agreement with a few other countries such as Germany and Japan, under which their currencies would appreciate against the dollar. This was done to reduce the US’ high trade deficit, something that Trump is attempting to fix today with tariffs.
The 1990s
The defining event that further led to gold underperforming in this decade was the end of the Cold War in December 1991. The greatest geopolitical threat of the previous 45 years was eliminated with this, heralding the start of a new era of an unipolar world with the US as the sole superpower.
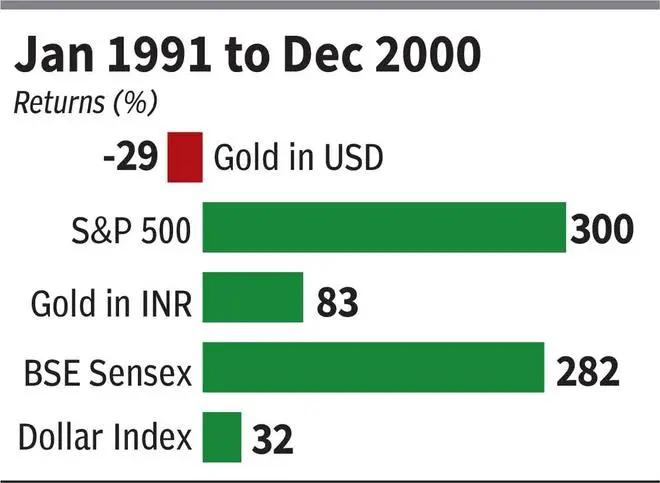
It was a terrible decade for gold, during which it fell 29 per cent atop a decline of 35 per cent in the prior decade. Low inflation (average monthly CPI of 2.8 per cent for the decade), lower interest rates, the dotcom revolution and US hegemony, and, of course, euphoric investors — all contributed to a stellar decade for US stocks, in which the S&P 500 was up 300 per cent.
The other crucial aspect of this decade that needs to be strongly noted is something that is apparently anathema to developed market governments in present times — balancing the budget. By the end of the decade, the then US President Bill Clinton actually balanced the budget and raked in a surplus! Yes, he actually did that! Responsible government spending and low inflation – the kind of things that pressure gold prices, reflected in its underperformance. The dollar index surged 32 per cent in the decade.
The 2000s
After a two-decade lull, this was the decade that sowed the seeds for the current gold bull market. After the dotcom bust and recession that followed, the US Fed, under Alan Greenspan, embarked on a new era of easy money to stimulate the economy. Ultra-low interest rates, significant deregulations and loose lending standards in the financial sector that caused a credit boom, and the start of a new government spending binge provided the perfect fuel to ignite a new gold bull-run. Later in the decade, global central banks embarking on a new era of quantitative easing (QE) was jet fuel for the yellow metal.
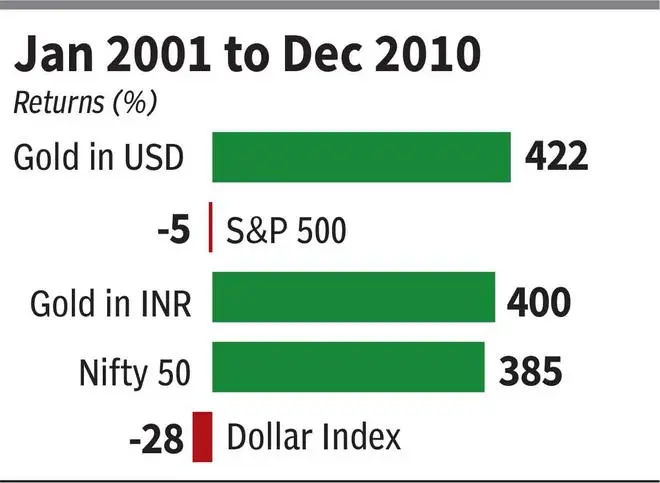
Basically, this decade saw the reversal of the responsible government spending implemented by Bill Clinton in the 1990s and responsible central banking implemented by Paul Volcker. There should be no surprise that gold was in favour again. The stellar run of gold, which returned 422 per cent in the decade, can be split into two parts: Pre-QE period (2001-07) and post-QE period (2007-10) during which it returned 206 per cent and 70 per cent respectively. The whole period was a washout and a lost decade for US equities with the S&P 500 returning negative 5 per cent.
The recovery from the lows of the dotcom bust was entirely overturned with the onset of the global financial crisis, like in a snake and ladder game.
The 2010s
From a macro-economic perspective, one of the most-defining characteristics of this decade was the confoundingly-low interest rates despite loose central bank policies and expansionary fiscal policies. Low long-term bond yields as a consequence only emboldened governments to tread further on the spending binge. While there is no clear explanation for this, reasons attributed are innovations made possible by technological developments, global trade and exports from low-cost destinations, a demand shock to parts of economies due to the global financial crisis and the eurozone crisis.
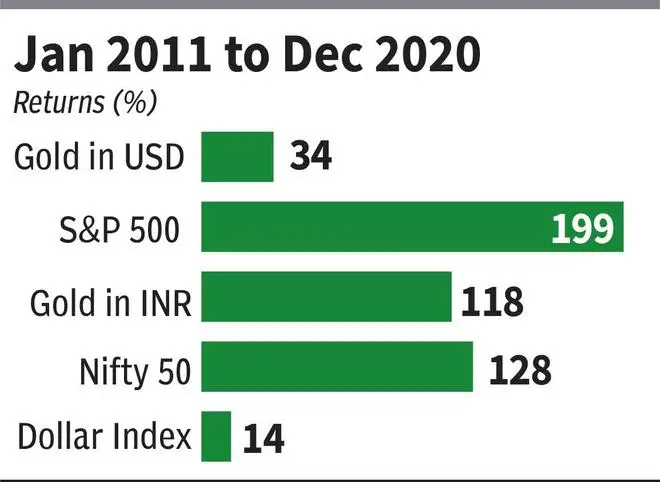
Hence, this was an unusual decade where in spite of a deluge of liquidity, inflation was low. It was an excellent decade for equities, while gold underperformed in USD terms although beating inflation solidly with its 34 per cent returns.
The current decade
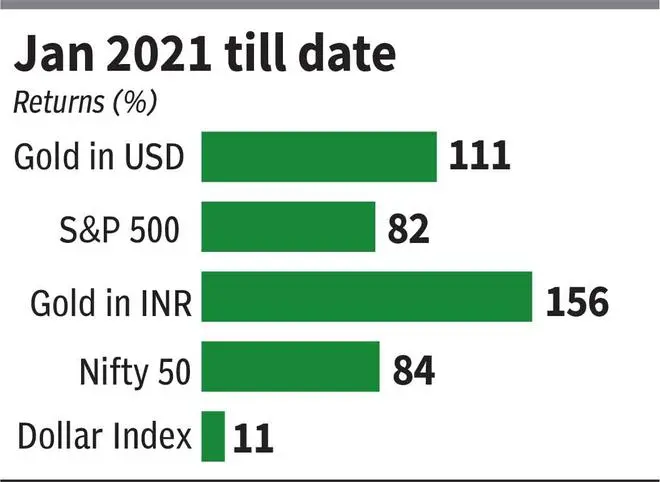
As the saying “You can run, but you cannot hide” goes, money printing can go on for a decade without consequences, but eventually it catches up. That seems to be the message in the current decade after the fiscal profligacy following the onset of the Covid pandemic and the ultra-loose central bank policies let the inflation genie out of the bottle. The problem appears to have got complicated more due to the unwarranted extended fiscal and monetary stimulus, even after economies had started recovering from the Covid shock. Today, as compared to low interest rates in the prior decade, developed market central banks are confronted with inflation continuing to sustain above their targets. In the US, inflation has trended above the Federal Reserve’s target of 2 per cent for 54 consecutive months and is likely to remain so for many more months. While there will not be any official acknowledgement, the US Federal Reserve has failed in its monetary policies —similar to what happened in the 1970s.
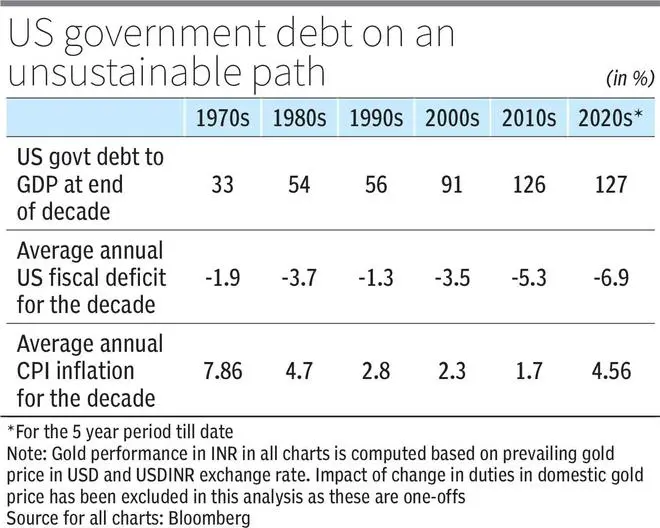
This is one of the main reasons that has driven the outperformance of gold in the current decade. Add to this, US government fiscal deficit at 6-7 per cent, when debt to GDP is at 127 per cent, implies government spending is on an unsustainable path.
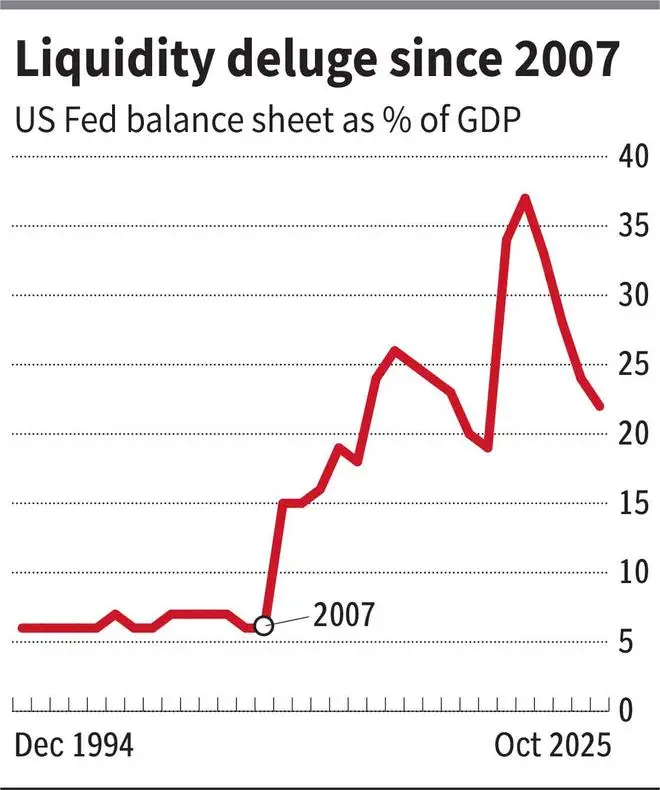
As if this alone weren’t enough, today geopolitics is at the most uncomfortable levels in the post-Cold War era – a key factor pushing central banks in China and Russia to increase gold holdings.
As Ray Dalio has said, the trends in the current decade reflect a confluence of factors similar to what transpired in the 1970s.
The important thing for investors note here from the charts – great decades for gold have been poor decades for S&P 500 and vice-versa.
However, bad decades for gold in USD, has not been bad for Indian investors in gold given rise in dollar index/rupee depreciation. This makes a good case to increase allocation to gold as compared to equities.
For the gold bull-run to end, it requires governments and central banks to do the right thing. Something like what Paul Volcker and Ronald Reagan did in the 1980s or Bill Clinton did in the 1990s with regard to government budget. It may not be too difficult to conclude for now that Jerome Powell is no Paul Volcker and Trump is no Bill Clinton when it comes to government finances. In that context, while gold may move up or down or be range-bound, the bull-run remains intact for now.
Published on November 1, 2025


